Simplifying cloud expenditure visibility for engineering teams.
Facets.cloud helped engineering teams provision and operate cloud infrastructure, but understanding what that infrastructure cost still meant leaving the platform and going to their respective cloud provider billing.
I designed Cloud Cost Explorer, giving teams visibility into spend across environments and helping them identify cloud expenditure.
100%
adoption rate by customers on AWS
~70%
reported reduction in non-prod cloud spend
~30K USD
reported customer savings
The gap
Facets customers managed development, QA, staging and production environments from one platform. But cost visibility lived elsewhere. Teams still relied on AWS billing tools to understand what they were spending, which environments were driving it, and how that spend was changing.
How might we help engineering teams understand where cloud spend is going and how it is changing, without requiring them to become AWS billing experts?
What customers needed
Customer conversations surfaced three recurring needs:
See where spend is concentrated
Compare environments without digging through AWS billing tools.
Understand change over time
Cost mattered for planning, not just reporting a total.
Make cost visible beyond Ops
Engineering leads needed access to cost information without becoming experts in AWS billing.
Some of the key questions I asked, which were thoughtfully answered by my users, included:
How often do you check your cloud cost data and export it?
Very Frequently. Cost data is used by us here at Capillary to plan our quarterly or semi-annually spendings. Having this feature is going to be a major boost for us as it'll reduce our dependency on other platforms.
Currently, how tedious is the process of tracking costs? Do people own the cost factor of the environments they launch?
Really Tedious. Cost is mainly the concern of Ops folks but by having a universal dashboard or something similar could help in developing a sense of ownership in everyone despite their roles and help us save some money.
Designing for less complexity
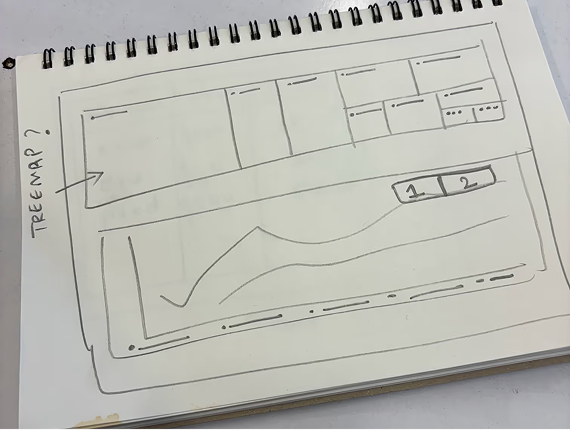
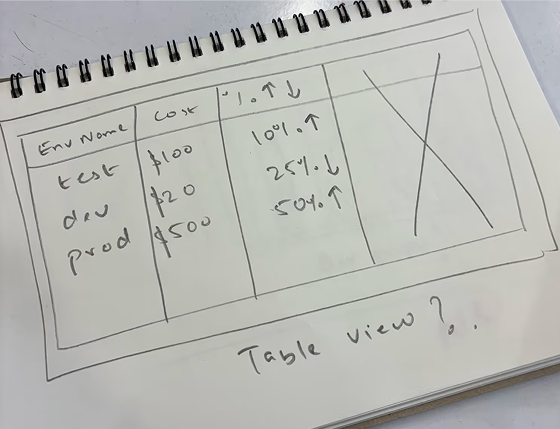
My first instinct was to build a traditional cost explorer with deeper hierarchical drill-downs. I explored a treemap to represent that structure. But the initial product hierarchy was much simpler:
Project (Previously known as Blueprint) → Environment
Most projects had a small, bounded set of environments. The extra complexity of a treemap wasn’t earning its place. So I focused the first release around two questions:
1. Where is our spend going? Compare costs across environments.
2. How is it changing? Track spend over time.
Cost visibility started before the dashboard
I initially assumed the hardest part would be designing the cost experience. It wasn’t. Facets first needed access to the customer’s AWS cost data. While activation was automatic for many customers, some consolidated-billing setups required manual AWS configuration and verification.
Users who landed on Cost Explorer before setup was complete therefore needed more than an empty dashboard.
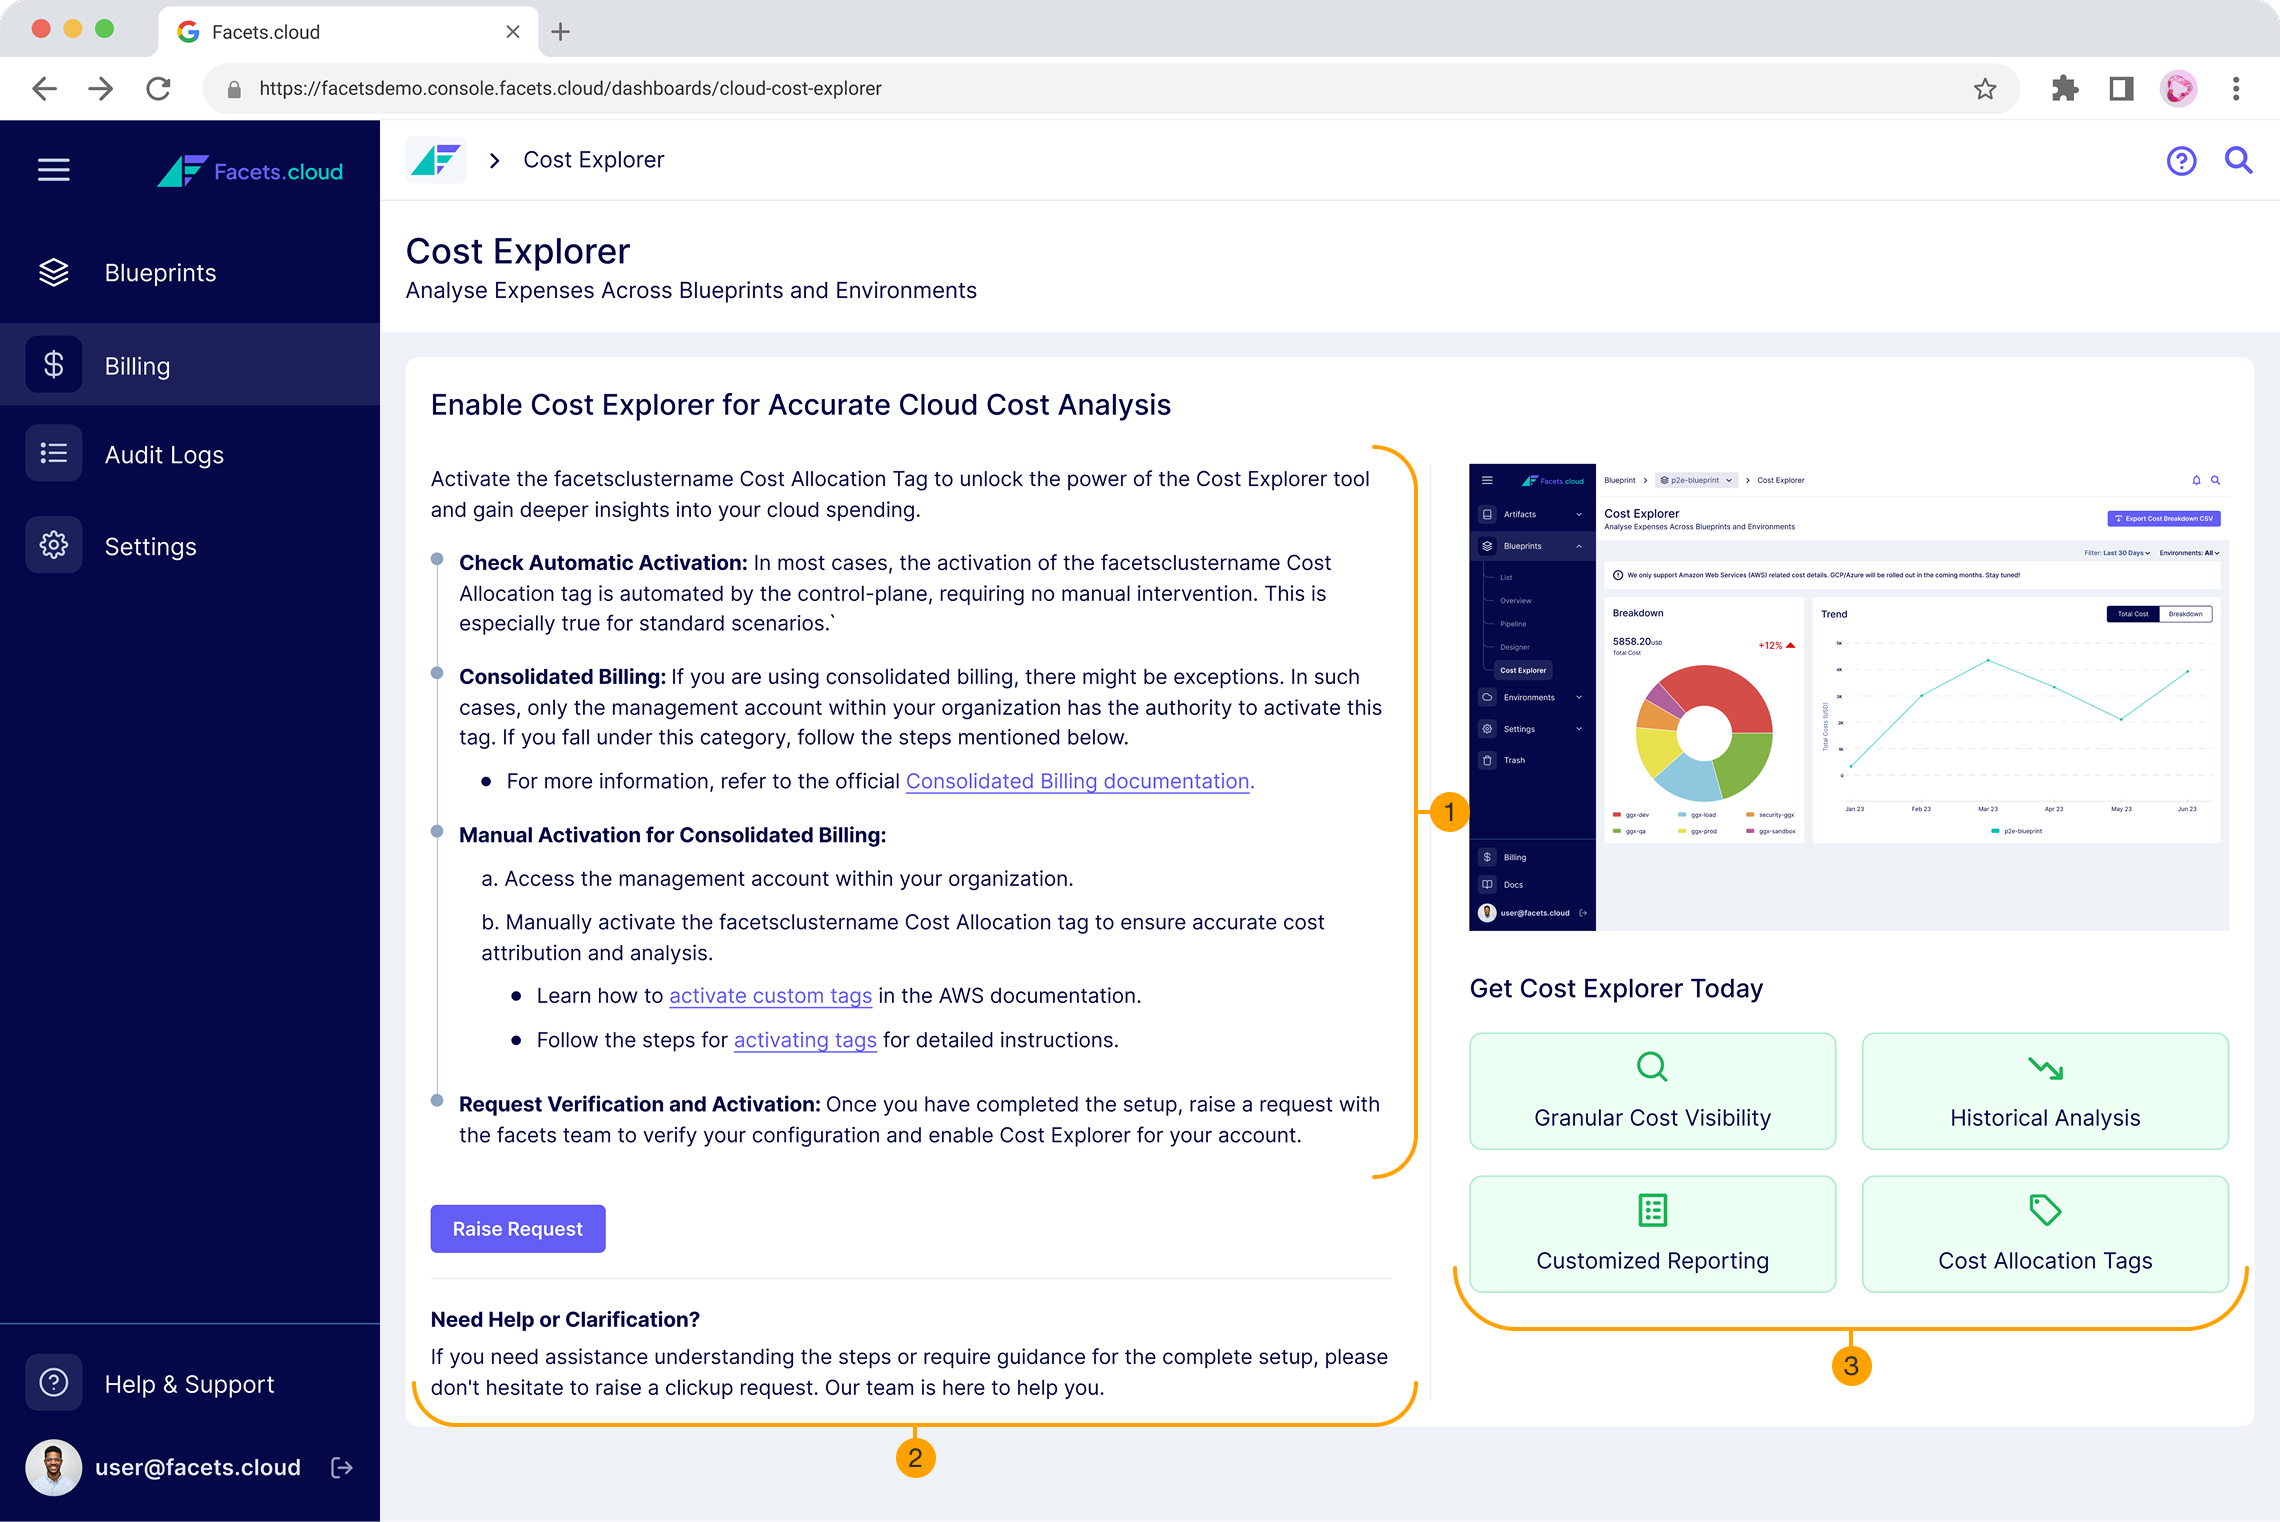

Steps explaining the users how they can enable Cost Explorer

Offer for support

Reinforces the value users unlock after setup
For the first rollout, activation still involved engineering support — a pragmatic compromise that let us ship the core experience before investing in fully self-serve onboarding.
Designing the experience
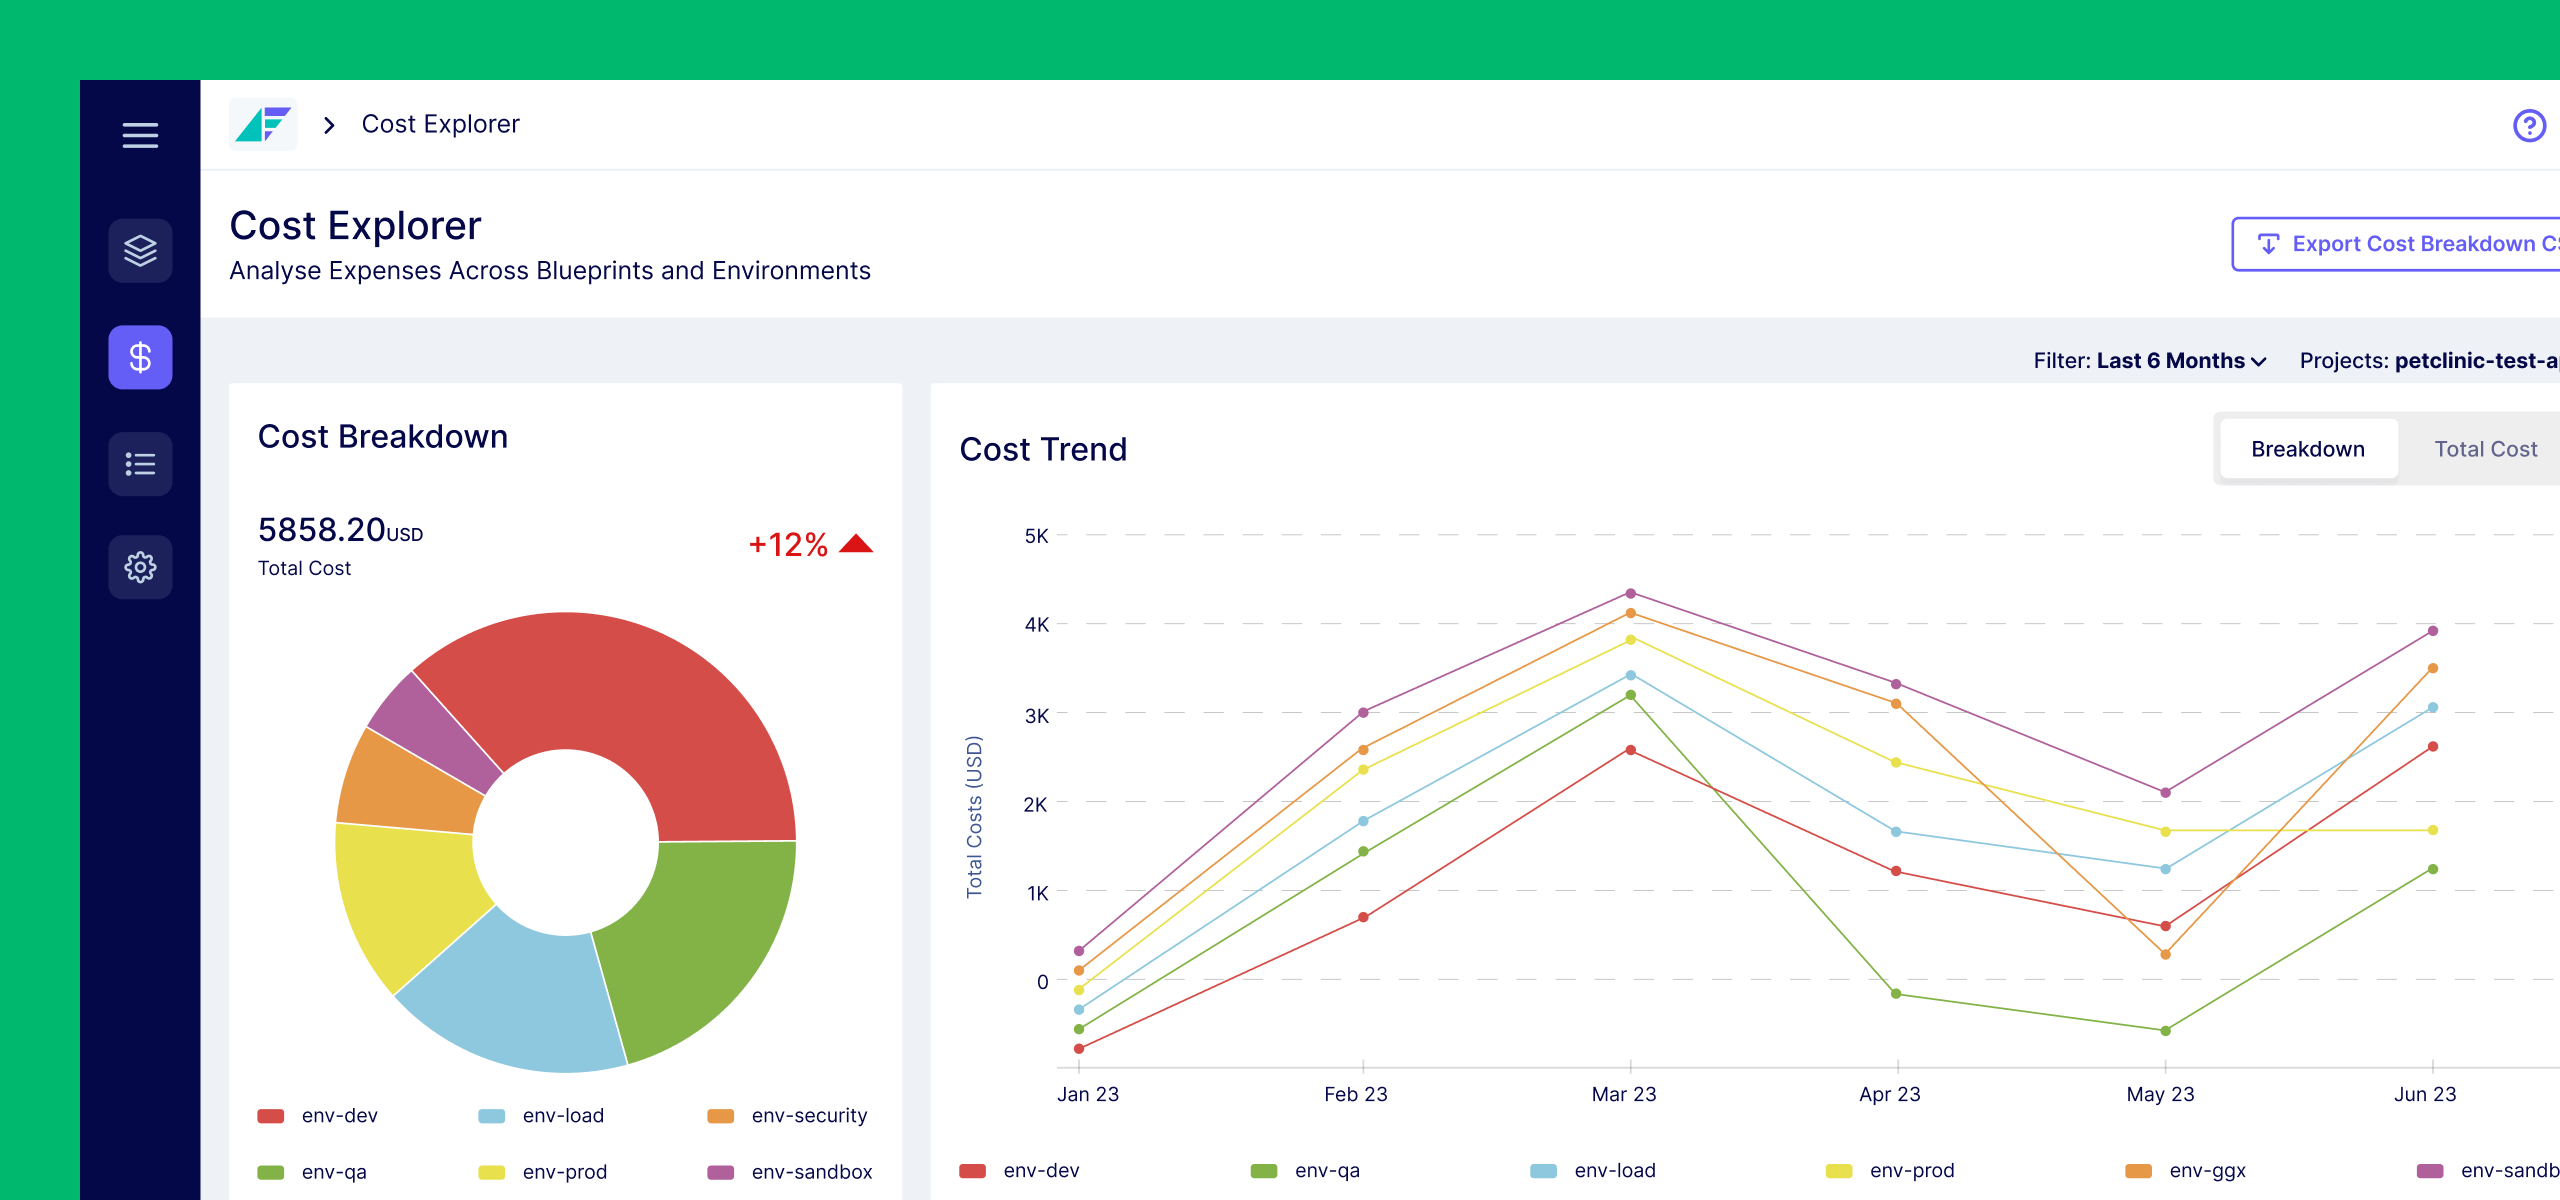
1. Where is the money going? The overview surfaced total spend alongside its distribution across environments.
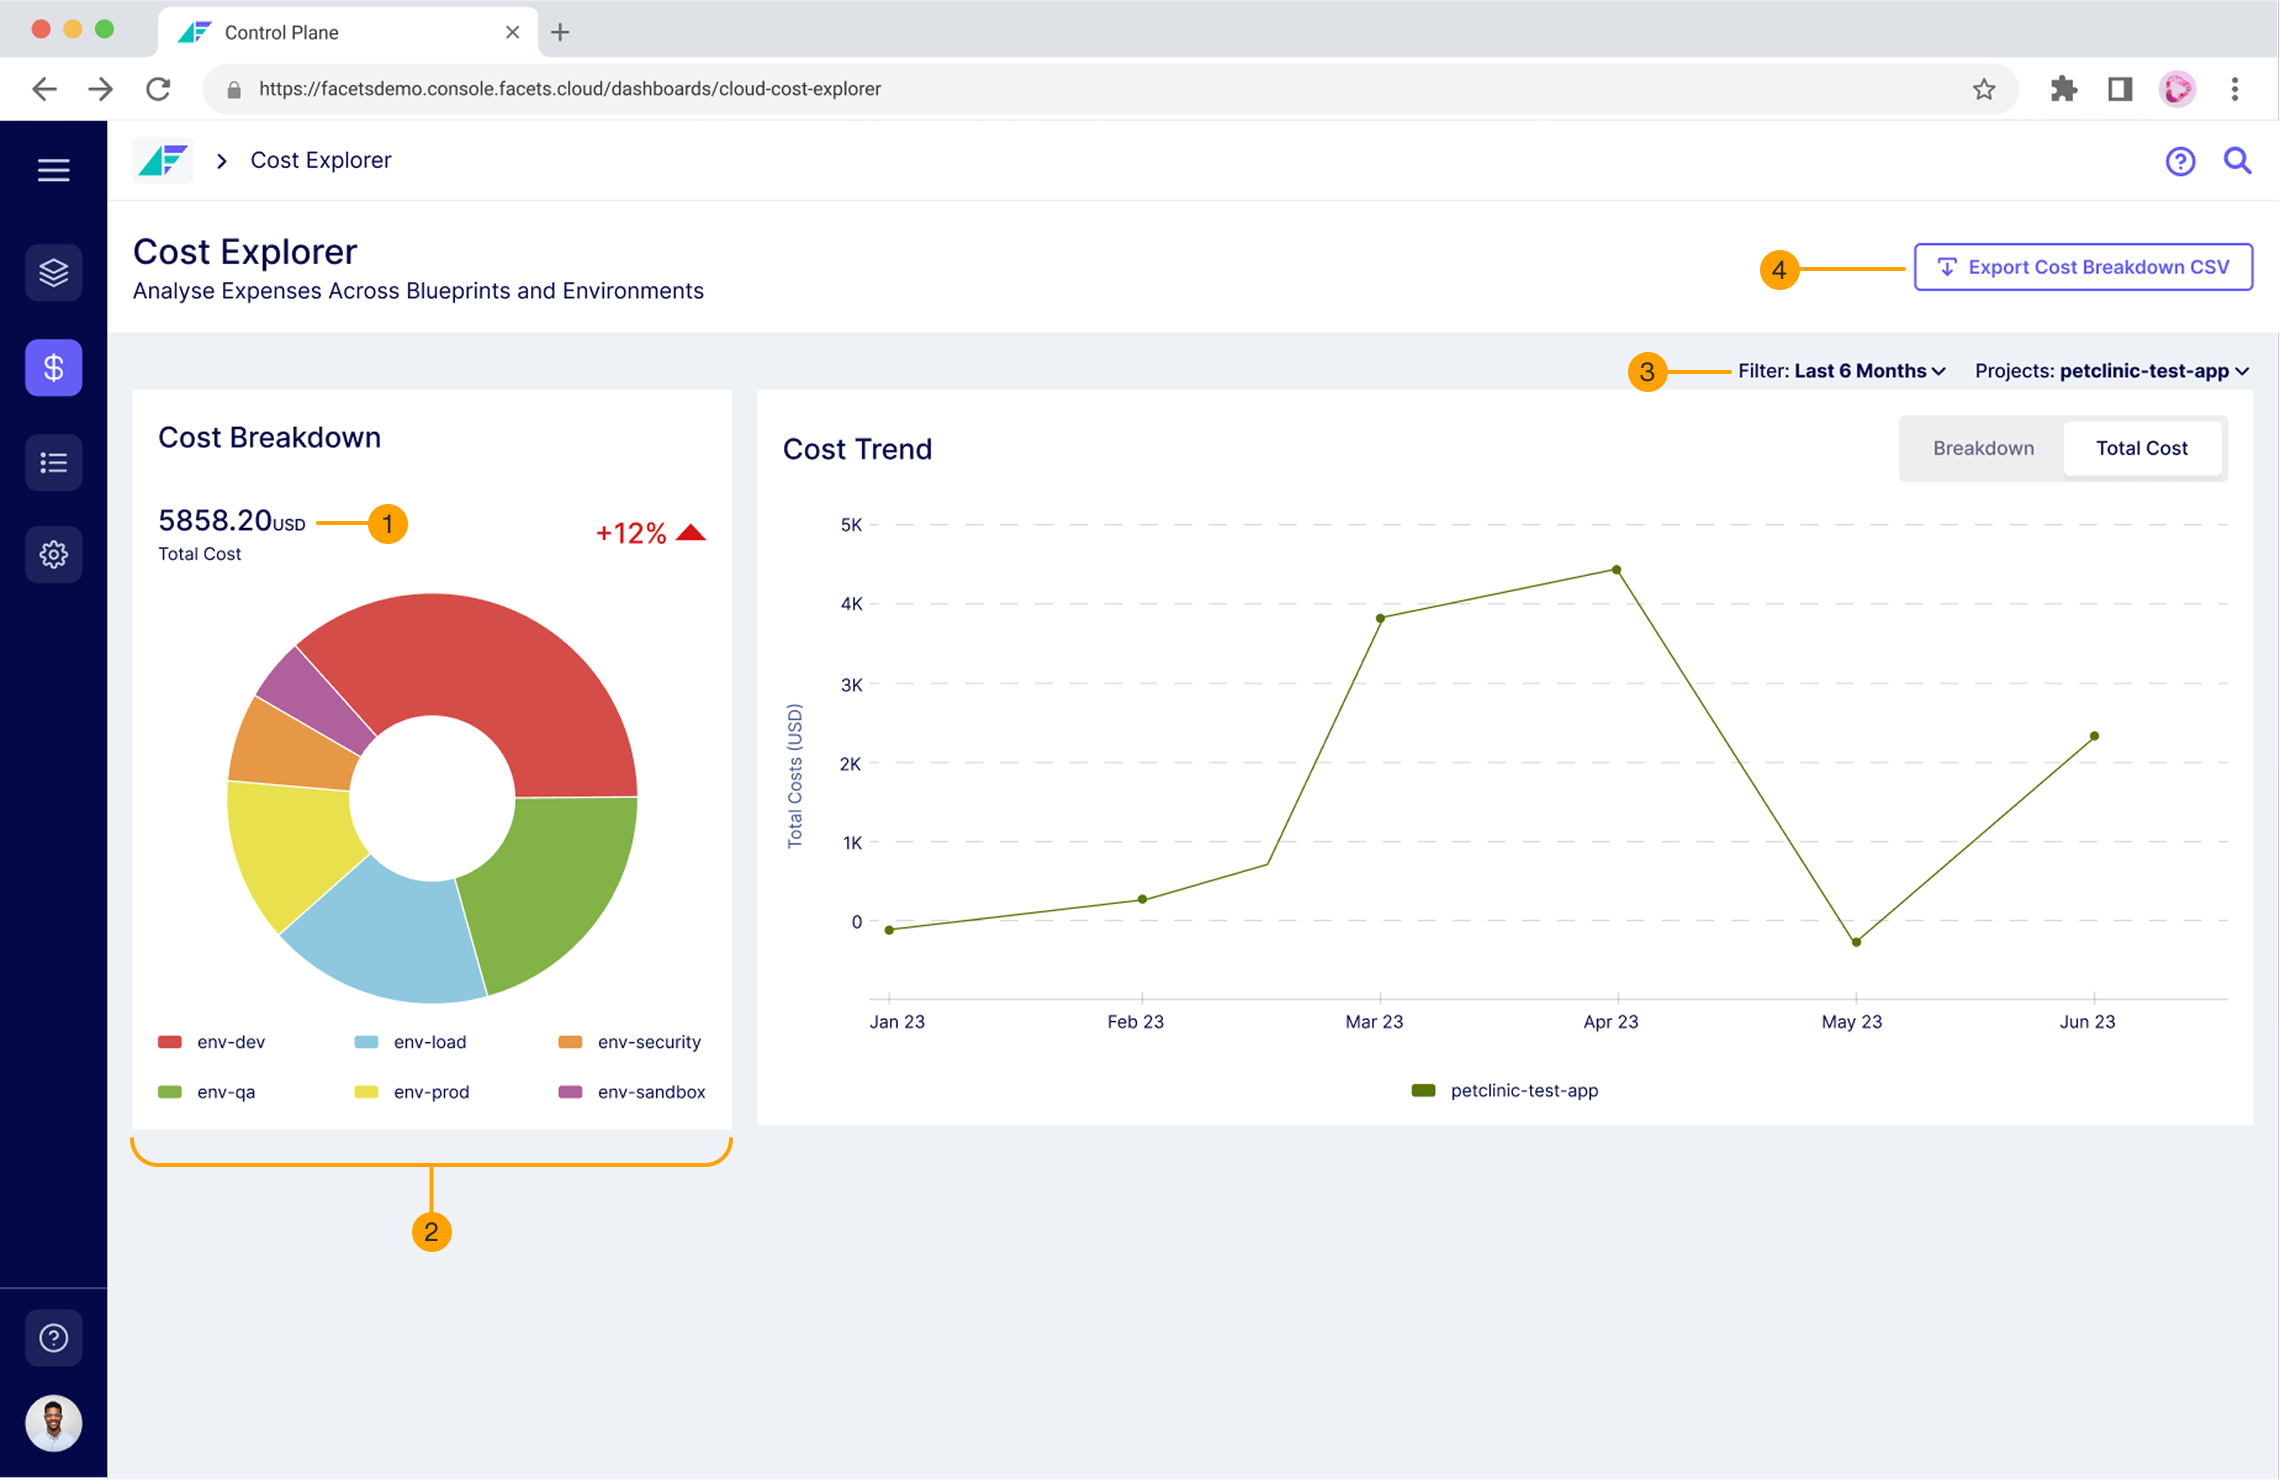
Total project spend: Establishes a baseline before users investigate individual environments.
Environment breakdown: Shows where spend is concentrated across development, QA, staging and production.
Time period: Lets users change the analysis window without leaving the project context.

Export cost breakdown: Downloads the underlying cost data as a CSV for deeper analysis, reporting, or sharing outside Facets.
2. Is spending getting better or worse? A total tells users what they spent. It doesn’t tell them whether things are changing. So the experience paired absolute cost with change over time.
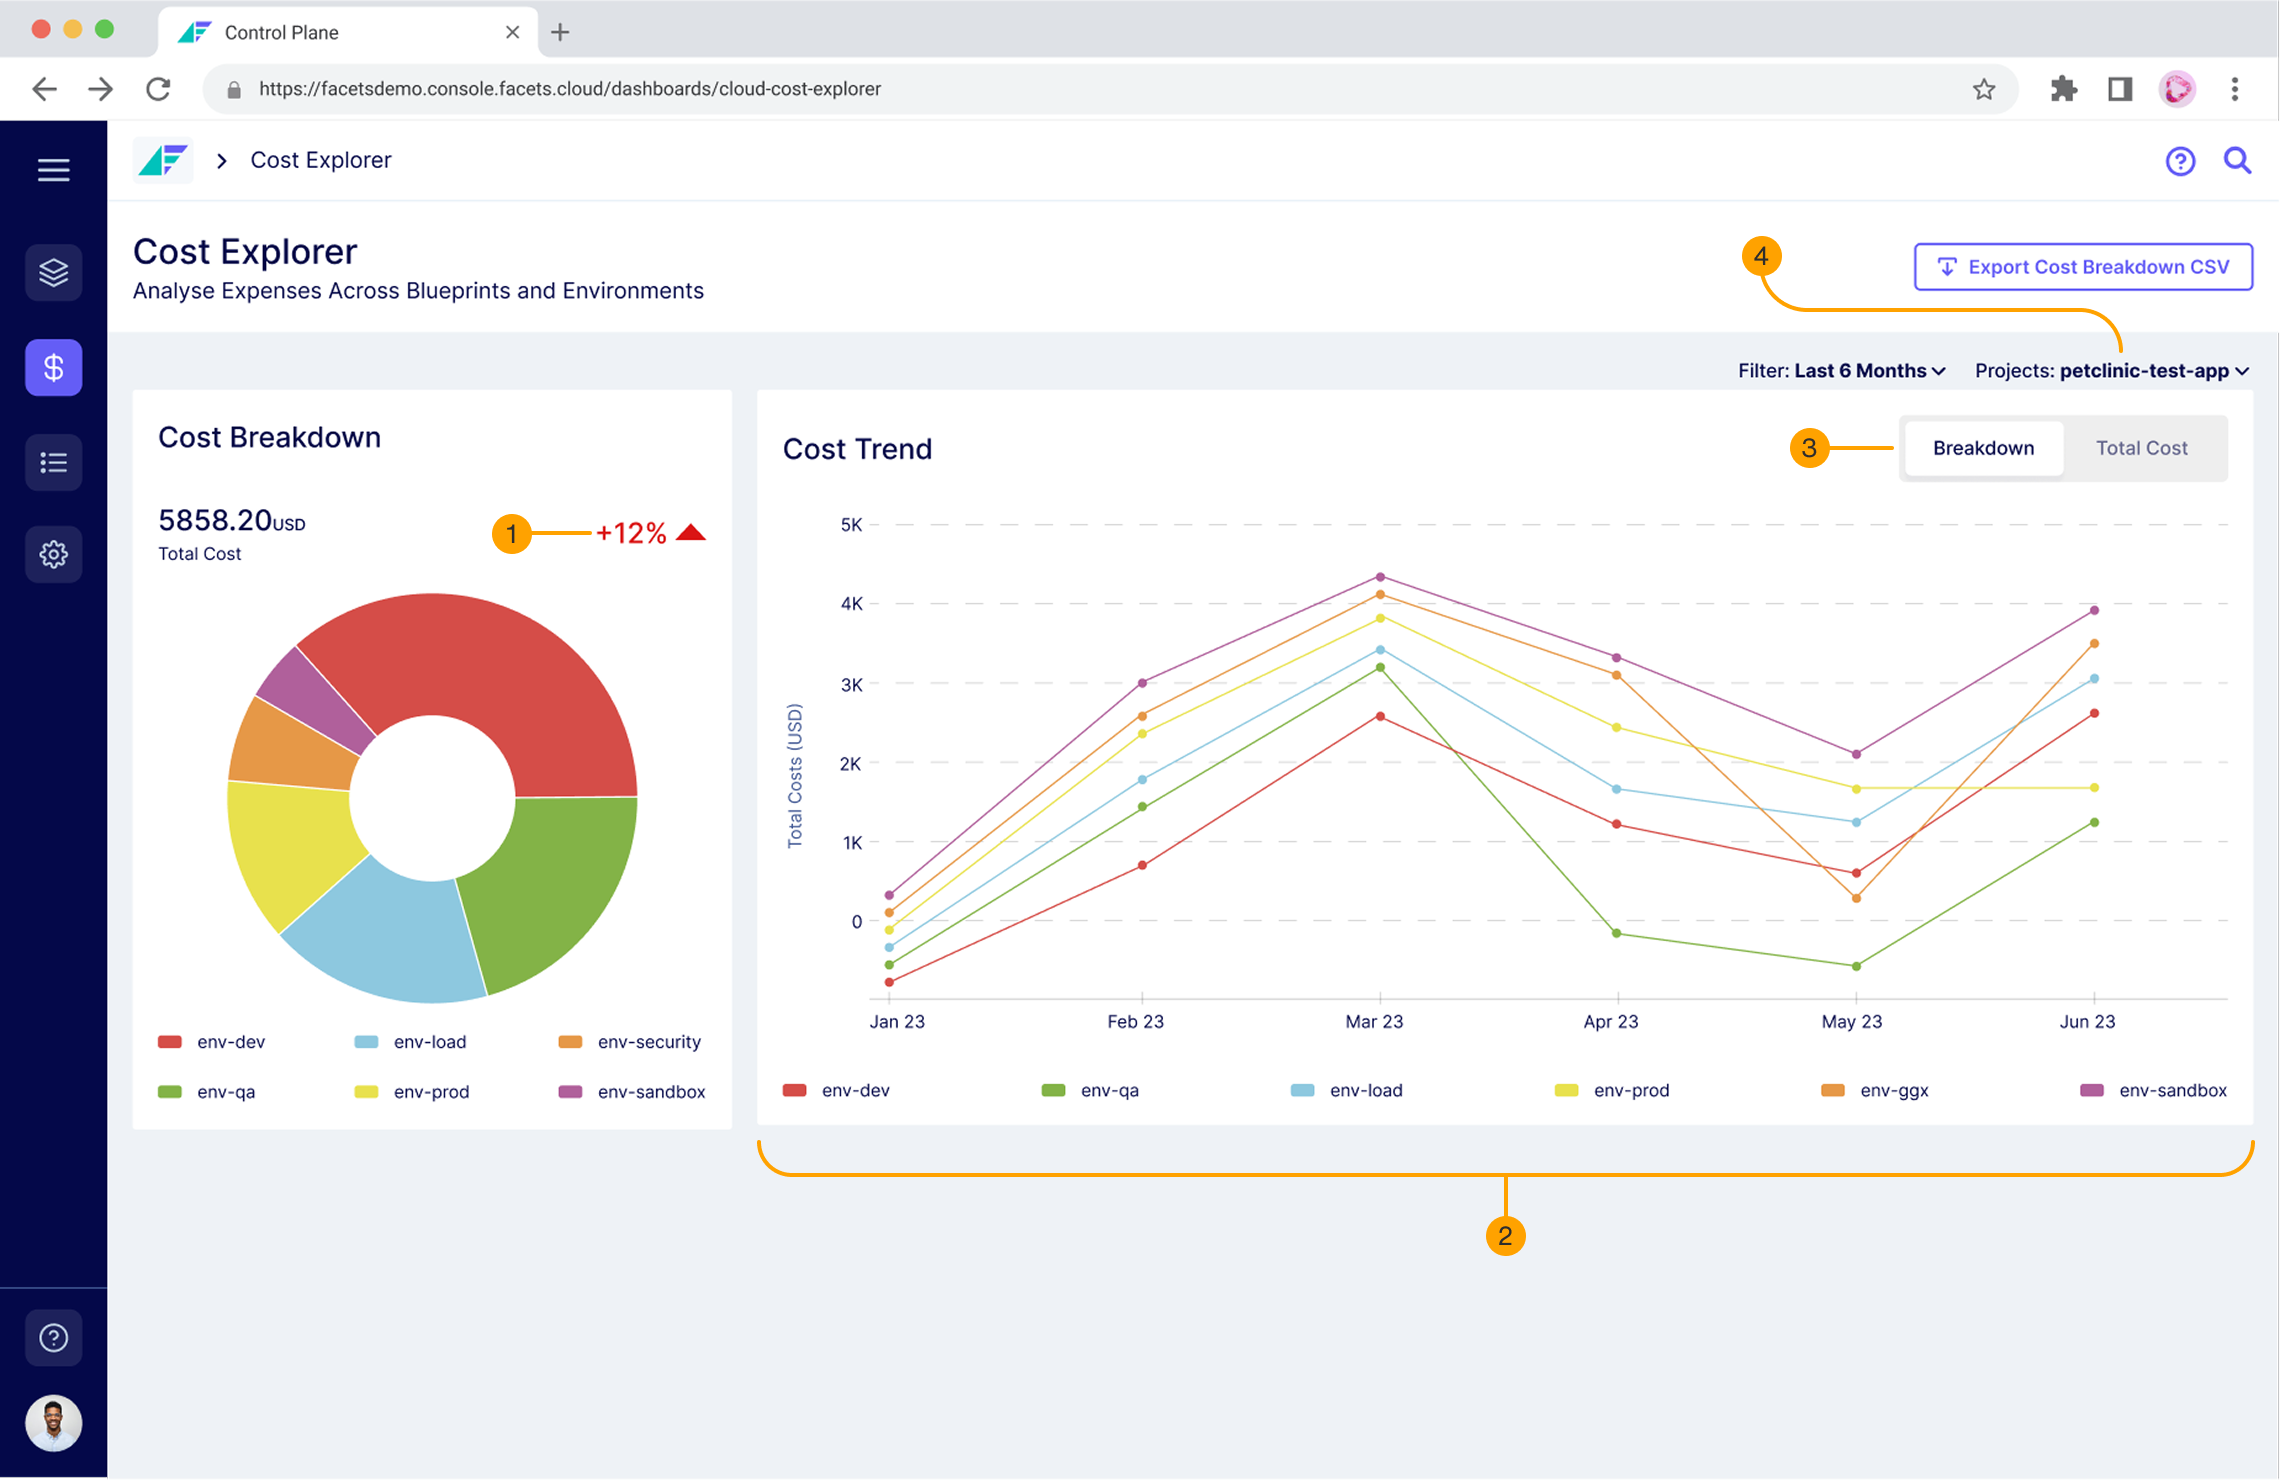
Percentage change: Adds direction to the number by comparing it with the previous period.
Cost trend: Makes spikes and gradual increases visible instead of reducing spend to one static figure.
Breakdown: Gives the user the ability to view trend of each environment or the entire project.
Project Switcher: Allows the user to switch to a different project
What Shipped
The first release enabled teams to:
1. Compare spend across environments
2. Track expenditure over time
3. Export the cost breakdown as CSV
Impact
100%
adoption rate by customers on AWS
Up to 70%
reported reduction in non-prod cloud spend
~30K USD
reported customer savings
Cloud Cost Explorer was rolled out across Facets’ AWS customer base and adopted by all 8 AWS customers. More importantly, I saw cost visibility start influencing behavior. Internally, our engineers became much more deliberate about non-production environments. By Friday evenings, unused environments would be shut down before people logged off rather than being left running through the weekend.
Customer and engineering feedback reportedly connected similar cost-management behavior with meaningful savings.
The feature kept evolving
The initial release focused on AWS and environment-level visibility. From there, we planned to expand Cost Explorer in two directions:
1. Deeper cost analysis Resource-level breakdowns would let teams move beyond environment-level spend and investigate which underlying resources were driving cost.
2. Budget-based alerts Users could set a budget for their infrastructure and receive a Slack or email notification when spend crossed that threshold—shifting Cost Explorer from passive visibility toward proactive cost management.
What I learned
The interface was only one part of the experience. Permissions, cloud configuration and delayed billing data were UX problems too.
If I approached it again, I’d define measurement alongside the design — tracking not only adoption, but whether viewing cost information actually caused teams to change infrastructure and reduce spend.